Shallow Geologic Storage of Carbon to Remove Atmospheric CO2 and Reduce Flood Risk
Researchers:
 Geologic carbon storage currently recognizes injection of CO2 into deep reservoirs, but we argue the concept should be expanded to include the injection of solid, carbon-bearing particles into shallow geologic formations. Wood is half carbon, available in large quantities at modest cost, and can be milled into particles and injected as a slurry. We demonstrate the feasibility of this approach by injecting a wood slurry at a rate of 15 tonnes of CO2-equivalent per hectare per day. The injection process also raised the ground surface at a rate of 1.5 mm/day. These rates upscale to a technique that could mitigate future warming by storing carbon as well as help communities adapt to future flooding risks by lifting the ground surface.
The need to remove carbon from the atmosphere to limit the negative effects of climate change is widely recognized (IPCC, 2013; IPCC, 2021; NAS, 2019). The development and evaluation of negative emission technologies (NETs) is urgent. Recent reviews (NAS, 2019; Minx et al., 2018) recognize a suite of nature-based NETs (coastal wetlands, forests, soils, ocean fertilization) that remove CO2 using photosynthesis and store the resulting biomass in terrestrial or marine ecosystems, and another engineering-based suite (direct air capture, bioenergy with carbon capture) that remove CO2 using separation technologies and store the resulting gas in deep geologic reservoirs. The nature-based methods can separate CO2 at low cost, but degradation of biomass in ecosystems puts the permanence of these carbon removal methods in question. The permanence of geologic storage is thought to be robust over time scales of millennia, but current technologies of separating CO2 from other gases are expensive and have limited widespread application.
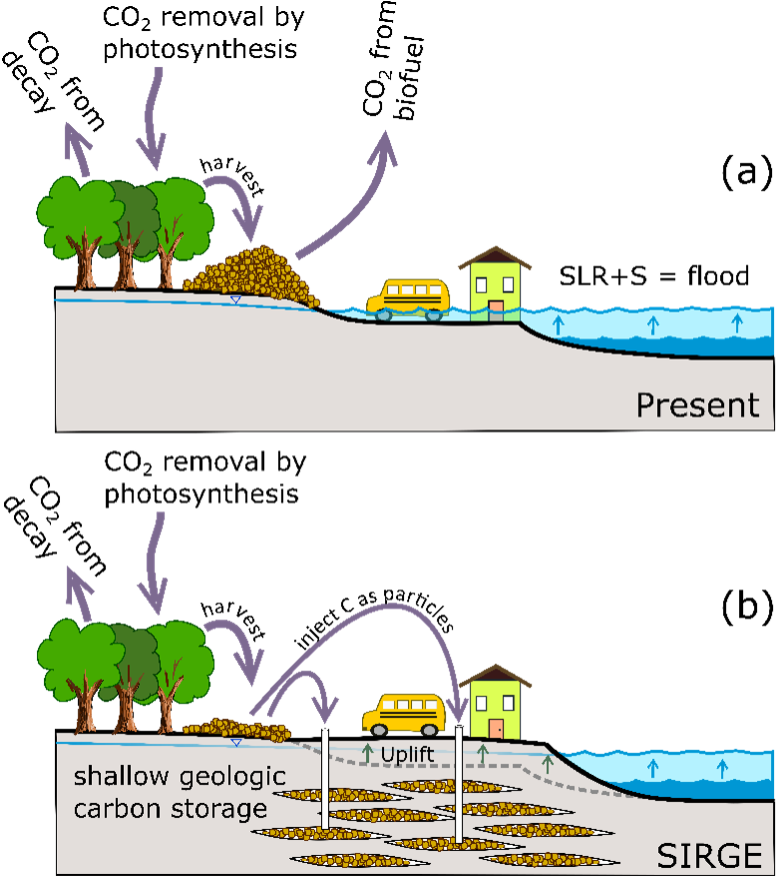
We introduce a NET that utilizes geologic storage, but in a different geologic setting and with different co-benefits than current methods. In a manner similar to hydraulic fracturing (Gidley, 1989), we inject solid, carbon-bearing particles in water-saturated formations at depths of 10s to 100s of meters, in volumes large enough to raise the ground surface up to several meters (Figure 1). The particles are injected at depths that are much shallower, and in a wider range of geologic formations than the deep reservoirs typically required for geologic storage of CO2. This approach shares the storage permanence of conventional geologic storage, but can be implemented at lower cost and in a wider range of geologic settings.
Life cycle assessment (LCA)
Our LCA followed the steps outlined in ISO 14040 and 14044 (Finkbeiner et al. 2006) of (1) goal and scope definition, (2) inventory analysis, (3) impact assessment, and (4) interpretation. These are discussed below.
Goal and scope definition
During goal definition the aim is to state the purpose of the study (i.e. what question are we trying to answer?) and the intended audience. The purpose of our LCA is to establish a baseline for the carbon benefit and potential environmental impacts associated with the CarbonSIRGE process. This information will be beneficial to decision-makers, e.g. in funding agencies, about the potential for inclusion of CarbonSIRGE within an investment portfolio.
During scope definition, the aim is to clearly articulate the product system under study including the function, indentifying an appropriate functional, defining the system boundary (i.e. what processes and life cycle phases are included) and the location of the system or processes involved.
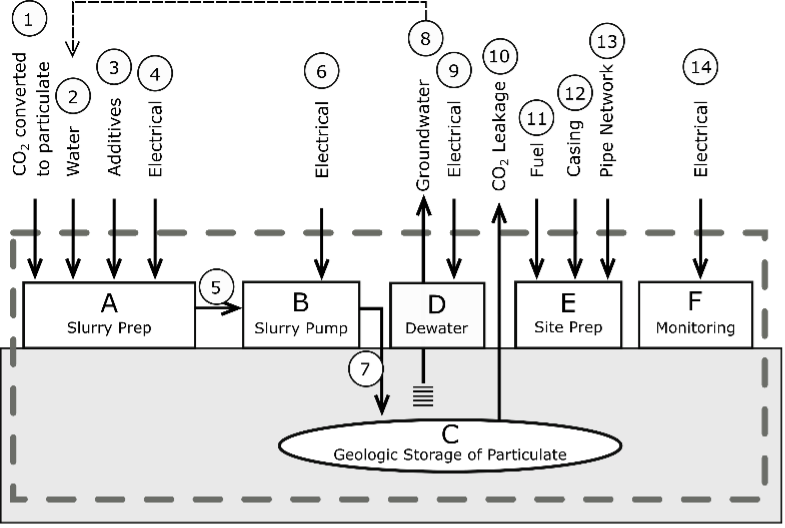
The function of CarbonSIRGE is two-fold: mitigation of climate change through the reduction of atmospheric concentrations of CO2 by geologic storage of carbon and adaptation to climate change through the reduction of flood risks by raising the elevation of flood-prone areas. For the purposes of this analysis, we will focus on the removal and storage of CO2. Our functional unit is the construction and operation of CarbonSIRGE facilities that can achieve 1.1 Mt/yr of CO2 removal and storage. The processes involved in the LCA are depicted in the figure below. Life cycle phases included are raw materials extraction and processing, installation, and operation. End-of-life of the facilities was not included since the equipment can be removed and reused at another location. Instead, we assumed that new equipment was needed at each location, thus likely overestimating impacts associated with capital equipment. Each facility was assumed to operate for a period of two years.
Inventory
During the life cycle inventory (LCI) step, we track flows of material and energy through our product system to identify a set of environmental flows to and from the environment for the delivery of our functional unit. For this study we used the ecoinvent 3.7 cutoff LCI database (Wernet et al. 2016). Product flows and amounts are reported at this link.
Impact assessment
The impact assessment method used was TRACI 2.1 (Bare et al. 2012). Based on the inventory presented in Table 8, the impact results were calculated, as presented in the table below.
| Impact category | Value | Units |
|---|---|---|
| Acidification (AP) | 4.38E+03 | kg SO2-eq |
| Carcinogenic | 5.00E-01 | CTUh |
| Ecotoxicity (ETP) | 2.10E+08 | CTUe |
| Eutrophication (EP) | 2.61E+03 | kg N-eq |
| Fossil fuel depletion (FFD) | 8.43E+05 | MJ surplus |
| Global warming (GWP) | 6.19E+05 | kg CO2-eq |
| Non-carcinogenic | 5.48E-01 | CTUh |
| Ozone depletion (ODP) | 8.09E-02 | kg CFC-11-eq |
| Respiratory effects | 9.68E_02 | kg PM2.5-eq |
| Smog | 1.05E+05 | kg O3-eq |
Interpretation
A breakdown of these results based on the different processes in Figure S13 is presented in Figure S15. As can be seen, the processes contribute vastly different proportions to the different impact categories. Site preparation, specifically production of equipment, is the major contributor to toxicity and eutrophication impacts. For the other impact categories, electricity (to run pumps) and transport (for both equipment and materials) together are the major contributors.
Looking more closely at global warming potential (GWP), pump production contributes around 24%, followed by electricity (23%), GHG leakage (15%), sawdust (11%), transport (10%), and guar gum (7%). The total 619 t CO2-eq of emissions represent around 4% of the 17.3 kt CO2-eq sequestered over the two-year operation of the site.
