Energy return on investment (EROI) harmonization
Researchers:
Net energy is the "energy profit" left after all energy investments to extract, process, convert, and distribute primary energy resources into final energy carriers has been accounted. This work explores the net energy of major energy technologies by conducting a meta-analysis of estimates of energy return on investment (EROI) and harmonizing the values at the point-of-use (POU). This work is published as a paper in a special issue on Sustainability of Energy Transition Scenarios in the journal Sustainability.
Thermal fuels
 The figure to the left shows the stages in a typical thermal fuel processing chain from point of extraction up to point of use. The table below indicates the investment at each stage in the production chain (unit inv), the upstream investment up to that point in the chain (chain inv) and the associate EROI at that point in the chain.
The data in this table was used to harmonize EROI estimates to POU for thermal fuels by supplementing any missing unit process in the estimates from literature. This data can also be used by future analysts to supplement their work to enable comparison with existing studies. The table is available as an excel file at this link.
| Supply chain stage | (2) Preparation | (3) Transmission | (4) Refining | (5) Purification | (6) Distribution | ||||||||||
| Fuel | Unit inv2 | Chain inv2 | EROI2 | Unit inv3 | Chain inv3 | EROI3 | Unit inv4 | Chain inv4 | EROI4 | Unit inv5 | Chain inv5 | EROI5 | Unit inv6 | Chain inv6 | EROI6 |
| Oil | 0.0% | 0.0% | ∞ | 1.5% | 1.5% | 67 | 8.9% | 10.4% | 10 | 0.0% | 10.4% | 10 | 1.1% | 11.5% | 9 |
| Gas | 0.0% | 0.0% | ∞ | 7.7% | 7.7% | 13 | 0.0% | 7.7% | 13 | 0.0% | 7.7% | 13 | 10.2% | 17.9% | 6 |
| Coal | 4.2% | 4.2% | 24 | 5.6% | 9.9% | 10 | 0.0% | 9.9% | 10 | 0.0% | 9.9% | 10 | 0.0% | 9.9% | 10 |
| Bioethanol (maize) | 0.0% | 0.0% | ∞ | 0.0% | 0.0% | ∞ | 60.5% | 60.5% | 2 | 2.2% | 62.6% | 2 | 1.5% | 64.1% | 2 |
| Bioethanol (sugarcane) | 0.0% | 0.0% | ∞ | 0.0% | 0.0% | ∞ | 2.5% | 2.5% | 39 | 2.2% | 4.7% | 21 | 0.0% | 4.7% | 21 |
| Bioethanol | 0.0% | 0.0% | ∞ | 0.0% | 0.0% | ∞ | 33.6% | 33.6% | 3 | 2.2% | 35.8% | 3 | 0.0% | 35.8% | 3 |
| Biogas | 0.0% | 0.0% | ∞ | 0.2% | 0.2% | 417 | 0.0% | 0.2% | 417 | 15.3% | 15.5% | 6 | 0.4% | 15.9% | 6 |
| Biodiesel | 3.3% | 3.3% | 30 | 1.7% | 4.9% | 20 | 5.4% | 10.3% | 10 | 0.0% | 10.3% | 10 | 0.0% | 10.3% | 10 |
| Wood pellets | 51.0% | 51.0% | 2 | 0.0% | 51.0% | 2 | 0.0% | 51.0% | 2 | 0.0% | 51.0% | 2 | 11.7% | 62.7% | 2 |
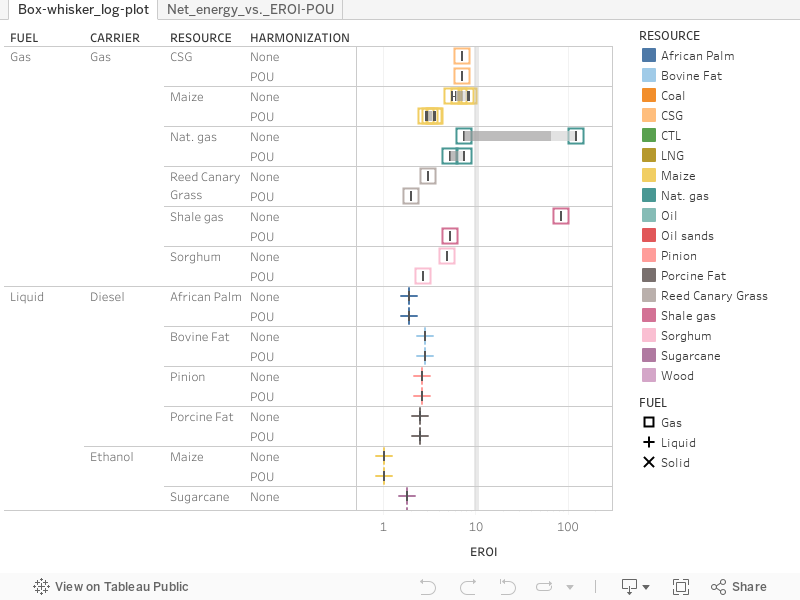
The results of the harmonization are presented in the interactive graphic below. On the first sheet is a box-whisker plot of the unharmonized EROI estimates and then harmonized to POU for the different resources, fuel types, and energy carriers. We mark an EROI of ten as a representative point. As can be seen, many thermal fuels do not achieve an EROI of ten, especially when considered at the point-of-use. In the second sheet, is a chart of net energy vs. EROI for thermal fuels at POU. Most of the fuels fall below an EROI of ten, meaning that less than 90% of the energy content in the fuel is available to society as net energy. Many of the the fuels, especially liquid biofuels, deliver far less net energy to society, with some even below 50%.
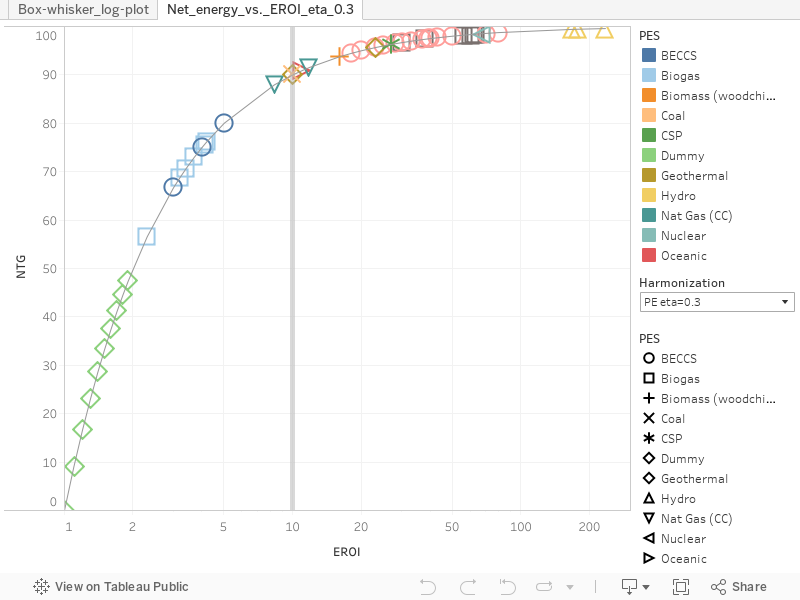
Electricity
The harmonization for electricity generation technologies was achieved by ensuring that a consistent energy quality correction factor was used to compare electricity output with primary energy investments. This was based on an assumed grid efficiency (PE eta) of 0.3 or 0.7. In the interactive graphic below, the first sheet again presents a box-whisker plot comparing unharmonized EROI estimates with those using PE eta = 0.3 and PE eta = 0.7 for different electricity generation technologies. As can be seen, most technologies, other than bio-based, achieve an EROI greater than 10. In the second sheet, we see net energy estimates, where many of the technologies deliver more than 90% net energy to society.